The Apple stock 10 year return was 29.2% a year with dividends reinvested — $10,000 put into AAPL at the end of July 2016 was worth $129,716 by the end of July 2026, a 13.0x gain. Without reinvesting the dividends you would have had $118,150, an 11.8x gain and 28.0% a year. Those figures come from our own monthly price database and Apple’s published dividend history, both adjusted for the 2020 stock split.
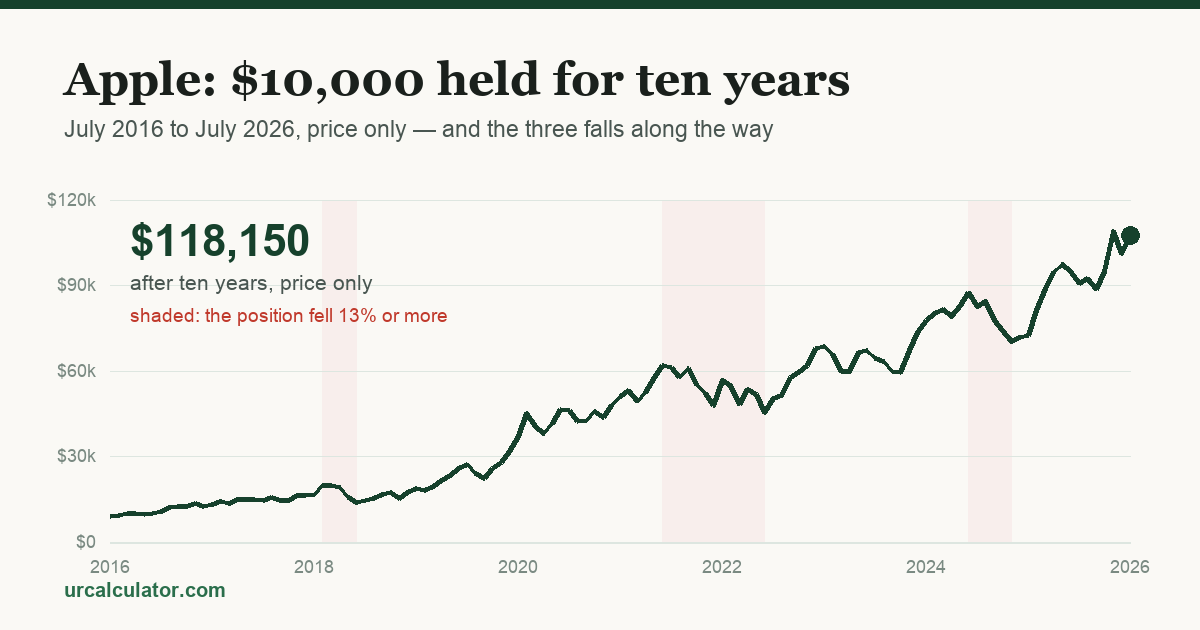
That is the answer. The rest of this page is the part most return calculators skip: which months produced the gain, how far the stock fell along the way, and why the same ten years paid a weekly investor a much smaller multiple.
The exact numbers, both ways
Window: month-end close 31 July 2016 to month-end close 31 July 2026. Start price $26.05, end price $307.81, both split-adjusted. Forty dividend payments landed in that window.
| Price only | Dividends reinvested | |
|---|---|---|
| Value July 2026 | $118,150 | $129,716 |
| Multiple | 11.8x | 13.0x |
| Annualised return | 28.0% / yr | 29.2% / yr |
Reinvesting added $11,566, or 9.8% on top of the price-only result. That is the whole contribution of dividends over a decade, and it is modest because Apple is not a high-yield stock — more on why that matters below.
If you see a slightly different figure elsewhere, check the dates before assuming one of them is wrong. A ten-year window ending in September 2026 instead of July catches two extra strong months and lands nearer 29.7% a year. Ten-year returns for a volatile stock move by a percentage point or more depending on which day you start.
What the 4:1 stock split does to the numbers
On 28 August 2020 Apple split its shares four for one: every share became four, each worth a quarter as much. Nobody gained or lost anything — it is the same pizza cut into more slices.
This matters because the $26.05 start price above is split-adjusted. In July 2016 Apple actually traded around $104. We divide every pre-split price by four so the series is comparable end to end. Almost all published charts do the same.
The trap is that dividends need the same treatment and often do not get it, which is the subject of a later section.
$100 a week versus the lump sum
Investing $100 a week over the same ten years — $51,960 in total — finished at $214,255 with dividends reinvested, or $203,261 on price alone. A gain of $163,000 on money you never had to have upfront.
| Lump sum $10,000 | $100 / week ($51,960 in) | |
|---|---|---|
| Value, dividends reinvested | $129,716 | $214,255 |
| Multiple on money invested | 13.0x | 4.12x |
| Value, price only | $118,150 | $203,261 |
The weekly investor ends with far more money and a far smaller multiple, and the reason is arithmetic rather than skill. Your multiple is the final price divided by your average buying price. The lump sum bought 384 shares at $26.05 and rode the whole decade. The weekly investor bought roughly 660 shares at an average cost of about $78.69, because most of those purchases happened in the later years when Apple was already expensive. $307.81 ÷ $78.69 = 3.9x, which is the price-only multiple almost exactly.
So a low multiple from regular investing is not underperformance. It is what happens when your average dollar has been invested for five years instead of ten. You can test both patterns on any stock with our stock and investment calculator.
Where the growth came from, year by year
Apple stock returns last 10 years were nowhere near evenly spread. Price-only, month-end close to month-end close, from our own database:
| Period | Return |
|---|---|
| Jul–Dec 2016 | +11.1% |
| 2017 | +46.1% |
| 2018 | −6.8% |
| 2019 | +86.2% |
| 2020 | +80.7% |
| 2021 | +33.8% |
| 2022 | −26.8% |
| 2023 | +48.2% |
| 2024 | +30.1% |
| 2025 | +8.6% |
| Jan–Jul 2026 | +13.2% |
Two years, 2019 and 2020, turned $1 into $3.36 between them. Strip those two out and the remaining eight and a half years compound to about 3.5x — good, but not the number anyone quotes. Two of the eleven periods were negative.
The five months that did most of the work
Take the same $10,000 price-only run and delete the best months, leaving everything else untouched.
| Scenario | Value July 2026 | Multiple | Annualised |
|---|---|---|---|
| Every month held | $118,150 | 11.8x | 28.0% |
| Missing the best 1 month | $97,292 | 9.7x | 25.5% |
| Missing the best 3 | $68,425 | 6.8x | 21.2% |
| Missing the best 5 | $50,830 | 5.1x | 17.7% |
| Missing the best 10 | $26,693 | 2.7x | 10.3% |
Ten months out of 120 carried 77% of the final value. The best five were August 2020 (+21.4%), August 2018 (+19.6%), July 2022 (+18.9%), July 2020 (+16.5%) and April 2020 (+15.5%).
Look at when they happened. April and July 2020 came immediately after the COVID crash. July 2022 came in the middle of a bear market. The months that mattered most arrived while the news was at its worst, which is precisely when a nervous holder is most likely to be sitting in cash. That is the practical argument for staying invested, and it is the same compounding effect explained in what is compound interest — with the volatility left in.
The drawdowns you had to hold through
A 13x return does not feel like 13x while it is happening. These are the six largest peak-to-trough falls on month-end closes, with what each did to the $10,000 lump sum.
| Peak | Trough | Fall | Position value |
|---|---|---|---|
| Aug 2018 | Dec 2018 | −30.7% | $21,843 → $15,137 (−$6,707) |
| Dec 2021 | Dec 2022 | −26.8% | $68,159 → $49,872 (−$18,286) |
| Dec 2024 | May 2025 | −19.8% | $96,121 → $77,094 (−$19,027) |
| Jan 2020 | Mar 2020 | −17.8% | $29,701 → $24,402 (−$5,299) |
| Aug 2020 | Oct 2020 | −15.6% | $49,531 → $41,785 (−$7,746) |
| Jul 2023 | Apr 2024 | −13.3% | $75,405 → $65,380 (−$10,026) |
Recovery took time as well as nerve. The August 2018 peak was not reclaimed until October 2019, fourteen months later. The December 2021 peak took until June 2023, eighteen months. The December 2024 peak took until September 2025.
Two things follow. The percentage falls got smaller as the company matured, but the dollar losses got bigger — the 2025 drawdown was the shallowest of the three big ones and cost the most money, $19,027. And because these are month-end closes, they understate the pain; intra-month lows were deeper than the table shows.
Why a dividend figure must be sanity-checked
Our first attempt at the total-return number produced a dividend contribution of 32.5% rather than 9.8% — as if reinvested dividends had added a third again to the result. For a stock like Apple that is far too high, and spotting why is a useful habit.
The check takes ten seconds. Apple yielded about 2.25% at the start of this window and about 0.34% at the end. Average roughly 1% a year over ten years, allow for compounding, and dividends should add somewhere in the low teens of percent. We got 9.8%, which fits. A third would need a yield two to three times higher, sustained for a decade — Apple has never been that stock.
The cause was a split-adjustment mismatch, and it is easy to walk into. Our prices are divided by four before 28 August 2020, but Nasdaq publishes historical dividend amounts as they were actually paid, unadjusted. The boundary is its own trap: Apple’s August 2020 dividend went ex on the 7th, three weeks before the split on the 28th, so it belongs on the pre-split side. Comparing by month rather than by the actual ex-date puts it on the wrong side and quietly inflates the result. Applied raw, the window’s dividends total $17.35 per share. Correctly adjusted, they total $8.45. Every pre-split payment was four times too large, credited against a price that was four times too small — the error compounds twice.
The rule: if your prices are split-adjusted, your dividends must be too. And before you trust any total-return figure, multiply the yield by the years. If the answer is not in the same neighbourhood, something is broken.
Apple was already the biggest company in the world in 2016
This is the part that decides whether the 13x is a lesson or just a fact.
Apple’s 2016 annual report, filed with the SEC, put the market value of shares held by non-affiliates at $578.8 billion as of 25 March 2016. Buying Apple in 2016 was not spotting an unknown. It was buying the largest listed company on earth, widely covered, widely owned, and not obviously cheap.
Which makes the survivorship problem sharp. Hendrik Bessembinder’s research in the Journal of Financial Economics found that across the entire US market since 1926, the best-performing 4% of listed companies account for the market’s whole net gain — the other 96% collectively did no better than one-month Treasury bills. We are looking at Apple’s ten years because Apple won. The 2016 shortlist of “obvious” large-cap technology bets also included names that went sideways or worse for a decade, and nobody writes those pages.
The honest reading of a 29.2% annual return is that it is an outlier, not a baseline. A diversified expectation is closer to the 7–10% long-run range you would put into our compound interest calculator.
Frequently asked questions
What is Apple’s 10 year return?
13.0x with dividends reinvested for the ten years to 31 July 2026 — $10,000 became $129,716. Price only, it was 11.8x, or $118,150.
What is Apple’s rate of return over the last 10 years, annualised?
29.2% a year with dividends reinvested, 28.0% price only. A window ending a month or two later gives a slightly higher figure, because the exact start and end dates matter for a volatile stock.
What is the AAPL 10 year return without dividends?
$118,150 on $10,000, or 28.0% a year. Dividends added 9.8% on top of that — meaningful, but small next to the price move, because Apple’s yield fell from 2.25% to 0.34% across the decade.
What would 10,000 shares of Apple stock be worth?
At the 31 July 2026 close of $307.81, 10,000 shares were worth $3,078,100. Buying 10,000 shares at the July 2016 split-adjusted price of $26.05 would have cost $260,525 — though in 2016 you would have bought 2,500 actual shares at about $104, and the 2020 split turned them into 10,000.
Was Apple’s 10 year return better than the S&P 500?
Substantially, by roughly four times on a total-return basis over this period. That is the definition of an outlier, and it is not a reason to expect a repeat.
Does a 29.2% ten-year return tell you anything about the next ten years?
No. Past performance does not predict future returns. Apple’s ten-year figure is a measurement of what happened, and the same ten years included three falls of 20% or more.
Sources and method
Prices are month-end closes from urcalculator’s own market database (121 monthly observations, July 2016 to July 2026), split-adjusted for the 4:1 split of 28 August 2020. Dividend amounts come from Nasdaq’s published Apple dividend history — 40 payments in the window — with pre-split payments divided by four to match the adjusted price series. Dividends are reinvested at the closing price of the month in which they went ex-dividend. Returns are in US dollars, before tax and before any currency conversion; a Canadian holder’s outcome also turns on where the CAD/USD rate sat at each end, and on the withholding the United States applies to dividends paid abroad — treated differently again depending on which registered account the shares sit in.
Apple Inc. Form 10-K, fiscal 2016 (SEC EDGAR) — $578,807,000,000 market value held by non-affiliates, 25 March 2016 · Apple Investor Relations FAQ — stock split history · Bessembinder, “Do stocks outperform Treasury bills?”, Journal of Financial Economics 129 (2018) 440–457
Figures as of the 31 July 2026 month-end close. This article is general information, not financial advice. It describes what one stock did in the past; it is not a recommendation to buy or sell anything, and past performance does not predict future returns. See our disclaimer.
Who made this. urcalculator.com is built and maintained by Hariom J., who is not an accountant, tax preparer or financial adviser. Every figure on this page is taken from a primary source — the government departments that publish the rules — and cited, so you can check it rather than take anyone’s word for it. That is the standard this site is held to instead of professional authority. For a decision that turns on your own circumstances, speak to someone qualified who knows them. See how these pages are built and our disclaimer.